Ernesto Hontoria
A Data Table is a wonderful Excel solution to automate sensitivity analysis, and to help us to understand the influence of one or two variables in the outcome of an Excel model. The tool works auto populating the results of the model in a table, in a similar way one person would manually do changing the value of a variable and taking notes of the results. In other words, you can use a data table to automatically populate the results of different incomes in a table.
Let
see how the Data Tables work with an example:
Assume
you want to rent a store to sell shoes. The rent is $ 1,000 a month plus $300
by month in utilities. You want to know how many pairs of shoes you need to
sell every month just to cover the rent and utilities, before making any deal.
The range of selling prices, for the shoes you plan to sell, is between $50 and
$100, and you know that the average margin for the industry is around is 30%.
Here are the steps to build the data table:
- Create an excel model with
variables in independent cells like the picture below. Cell C9 equals C7 + C8,
while F9 equals F7 times F8. Units to Cover Fixed cost in cell F12 = C9/F9

Figure 1: Creating a model in Excel - Let’s starts creating one variable
data table to analyze the price effect. Type the range of prices you want to
analyze in cells E13 to E18.

Figure 2: Creating a One Variable Data Table - Select the range E12:F18,
then on the Data tab, in the Forecast group, click What-If Analysis, click Data
Table

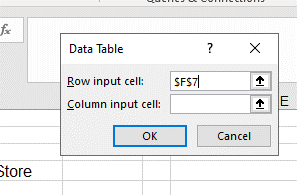
Figure 3: Inserting a Data Table - A Data Table menu
screen will pop up, asking for row and column input cell. Since the variable we
want to analyze is the price, which is in cell F7, and we have populate the
values in the column of the table, we link cell F7 to the column input, and
click ok.

Figure 4: Linking the Data Table to a variable in the model
 |
| Figure 5: One Variable Data Table - Horizontal |
 |
| Figure 6: In an Horizontal One Variable Table link the row to the model |
Data tables can be used as
well to analyze how the combination of two variables impact your results. Say
for example that you want to analyze the effect of the selling price combined
with the margin. In that case you can build a data table with the values of one
variable in the rows and the values of a second variable in the column as shown
in Figure
7.
Figure 7: Two variables Data Table
- To build a two variable data table, type the values you want one of the variables to take, in the cells beside the formula; and the values you want for the second variable in the cells beneath the formula. For example, if you want to analyze the combination of margin and price in a two variable data table, and the formula is in cell F12.
- Type the different margin rates in cells G12 to M12, beside the formula.
- Type the prices in cells F13 to F18 beneath F12.
- Select the table from
F12 (formula) to the last value in the table in both directions M18, then with
the table selected, go to the Data tab, and click What-If Analysis in the
Forecast group. Then click Data Table

Figure 8: Inserting a Data Table - The screen menu of the data
table will pop up. Click in the 'Row input cell' box and select cell F8, to
link the margin % values of your table (row) to the cell F8. Then click in the
'Column input cell' box and select cell F7, to link the prices in the column of
you table to the variable F7 of your model. Then click ok.

Figure 9: Linking the model to a two variables Data Table

